

Team and process
Role: Senior UX / Researcher
Team: 1 UI designer, 2 POs, 8 devs, 2 QA, 1 Scrum Master (agile)
Responsibility: UX research, design, responsive & cross-device UX, design management

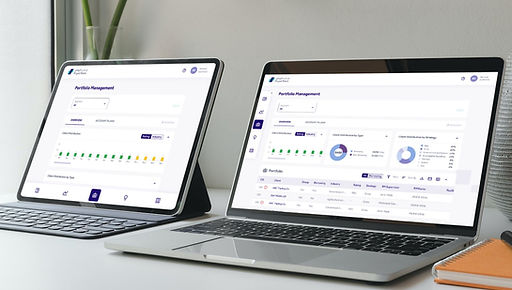
RM Workbench is a unified web application to consolidate nine fragmented tools into a single responsive dashboard - reducing cognitive load and speeding up decision-making for RMs and senior stakeholders.
areas of improvement
-
Multiple disconnected tools (9 apps + spreadsheets + paper) created a fragmented workflow
Previous Ecosystem of Tools

2. Business rules were inconsistent across hierarchies, requiring clarification and standardisation with stakeholders as the platform scaled, directly impacting how each user interacted with the system.
Hierarchy within the Client stakeholders

3. Without automated, data-driven visualisations, users faced information overload, struggled to interpret key insights, and found it difficult to spot trends critical for decision-making.
Previous mapping of data in spreadsheets

impact
Operational Efficiency at Scale: Rationalised fragmented user tasks and integrated legacy tools, improving task completion rates and reducing manual effort across teams.


Enhanced Advisor Productivity: Streamlined workflows and consolidated multiple tools into a unified platform, reducing context-switching and lowering cognitive load for Relationship Managers.
Reorganised data for different purposes and roles in the organization

Faster Decision-Making: Designed comprehensive dashboards and data visualisations that enabled users to quickly identify trends, monitor KPIs, and act with clarity.
Optimising workflow on the client project and the internal team
Improved Stakeholder Alignment: Standardised business rules and role-based experiences across hierarchical users, ensuring consistent understanding from RMs to CCBOs.
Improving data visualisation focusing on user needs

Scalable Experience Framework: Built a responsive interface and modular patterns that support scaling to new personas and expanding data complexity without compromising usability.
Scalable design


